At Interline Technologies, we help make open-source and open-data usable to professionals and hobbyists alike. Interline OSM Extracts, one of our services, provides city-sized chunks of crowdsourced mapping data available for free and easy download. It's up to each person to use their own GIS or web mapping tools to filter, visualize, or analyze the map extract — this requires some prior experience and some computing power. Now, with HERE XYZ Spaces, everyone can follow a simple workflow to download from Interline OSM Extracts and quickly begin to filter and visualize.
In this tutorial, we'll create an interactive web map of Honolulu that highlights some crowdsourced locations relevant to tourists. We'll be combining together Interline OSM Extracts (in GeoJSON format) with HERE XYZ Spaces (basemaps, CLI, and API). This tutorial assumes an intermediate level of skill.
What you'll learn
- How to download a GeoJSON extract from Interline OSM Extracts.
- How to upload your extract file to an XYZ Space.
- How to explore an XYZ Space and tags using the GeoJSON Viewer.
- How to create a web map that displays certain features and tags from an XYZ Space.
Prerequisites
- HERE XYZ account
- Basic familiarity with a terminal/command-line interface
OpenStreetMap (also known as OSM) is a crowdsourced, worldwide dataset that changes minute by minute. To work with the entire planet's worth of OSM data is a challenge for beginners. Furthermore, OSM data is typically stored in custom formats (XML or Protocol Buffer), unfamiliar to most users of GIS or mapping software. Instead of using OSM directly, we'll use the Interline OSM Extracts service to download data in the standard GeoJSON format for one region at a time.
We'll show you how to download OSM map data for Honolulu, Hawaii. Following the same instructions, you can then try downloading OSM data for another metropolitan region of your choice.
First, sign up for a free Interline OSM Extracts account. You will soon receive an email with an API token. Copy this API token to your clipboard — you'll use it shortly.
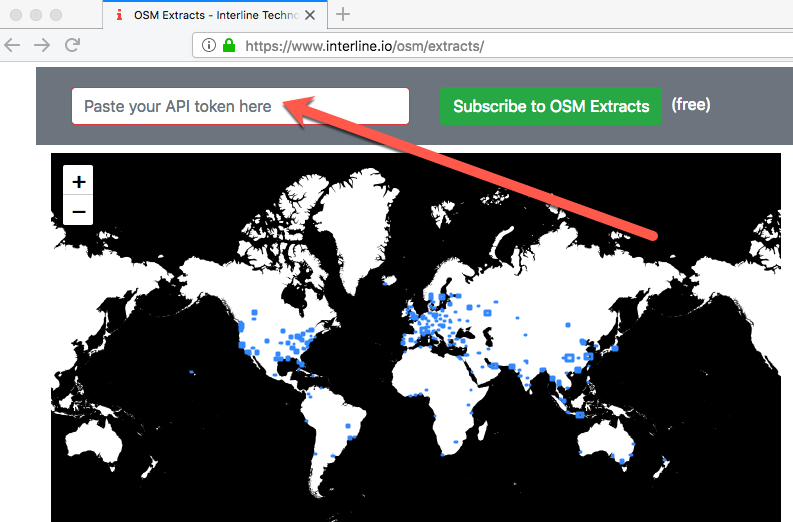
Next, open the Interline OSM Extracts website. Paste your API token into the form:
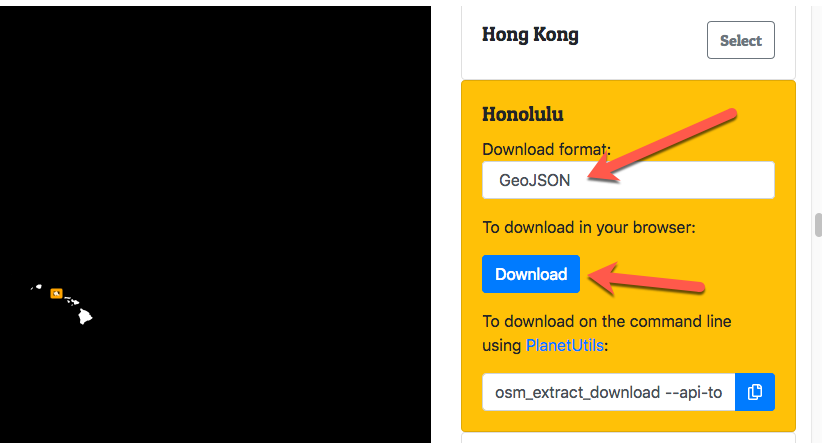
Now, scroll and click on Honolulu on the list of available extracts. (You can use your web browser's "find in this page" functionality to speed up the process.) Select "GeoJSON" for download format. Click the "Download" button:
Save the file to your computer. You'll need to open this file in your terminal, so place it in a directory that is memorable and easy to find.
If you want to skip the above steps of registering for an Interline OSM Extracts account: We've posted a public copy of the Honolulu extract. Use your web browser to download the file at https://storage.googleapis.com/osm-extracts.interline.io/honolulu_hawaii.geojson. Note, you should still register for Interline OSM Extracts when you're ready to try data for other regions.
We need to create an XYZ space to store, filter, and visualize our Interline OSM extract.
If you haven't already installed and configured the HERE CLI, follow this tutorial.
Now that you have the XYZ, run the following command to create a new space:
here xyz create -t 'tutorial'
This will return an ID for a new space, which in this example is e9PEZgZg:
xyzspace 'e9PEZgZg' created successfully
Copy and paste the ID into the following command. This will set an "environment variable" that stores the space ID. This will make it easier for us to reuse the space ID as an argument in future commands:
SPACE_ID=<returned space id>
Now that you have both the HERE CLI and an Interline OSM extract for Honolulu, let's upload it to your XYZ space.
OSM data includes hundreds of possible tags. Tags are all crowdsourced and can provide a street address or opening hours for a business. Or tags can be used to mark whether bicycles are allowed on a trail. To explore the wide range of possible OSM tags, see https://taginfo.openstreetmap.org/
Let's explore the amenity, shop and tourism tags around Honolulu. When importing the GeoJSON extract into your XYZ space, you'll mark these three as GeoJSON properties to turn into XYZ tags. Run the following command:
here xyz upload $SPACE_ID -f honolulu_hawaii.geojson -p amenity,shop,tourism
Now that you've uploaded and tagged your GeoJSON file, let's explore the data in the XYZ space. We'll look at the range of tags using the text-based CLI and using the HERE GeoJSON Viewer in your web browser. While exploring the data, we'll think about what we'd like to filter and visualize on a HERE web map.
To describe the tags using the CLI, run:
here xyz describe $SPACE_ID
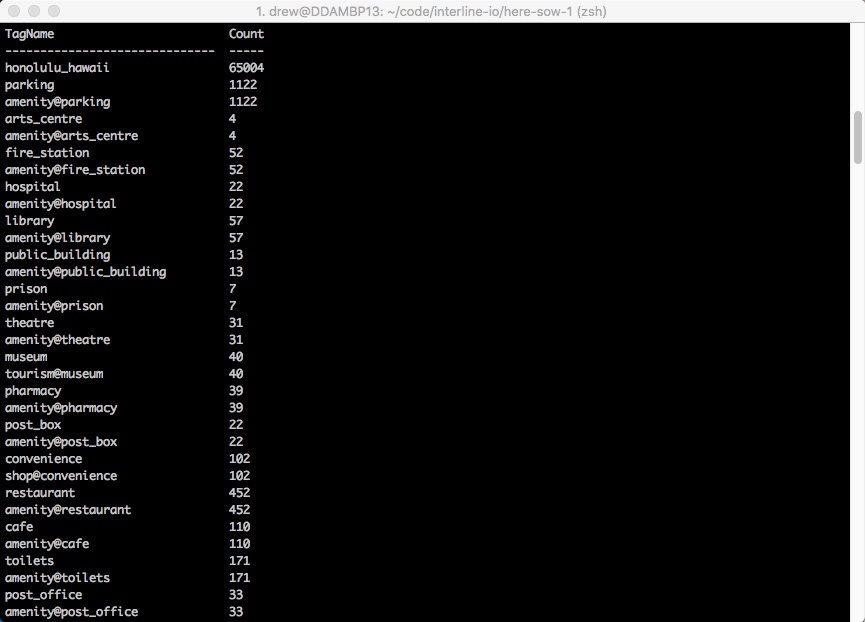
The output will list counts of the number of features (that is, locations) that have each of the tags and values. Note how there are 1,122 features tagged amenity@parking:
Let's visualize some of the locations that have the amenity tag with a value of parking. In other words, let's look at parking lots around Honolulu. Run the following command to open the GeoJSON Viewer in your web browser:
here xyz show $SPACE_ID -w --tags=amenity@parking
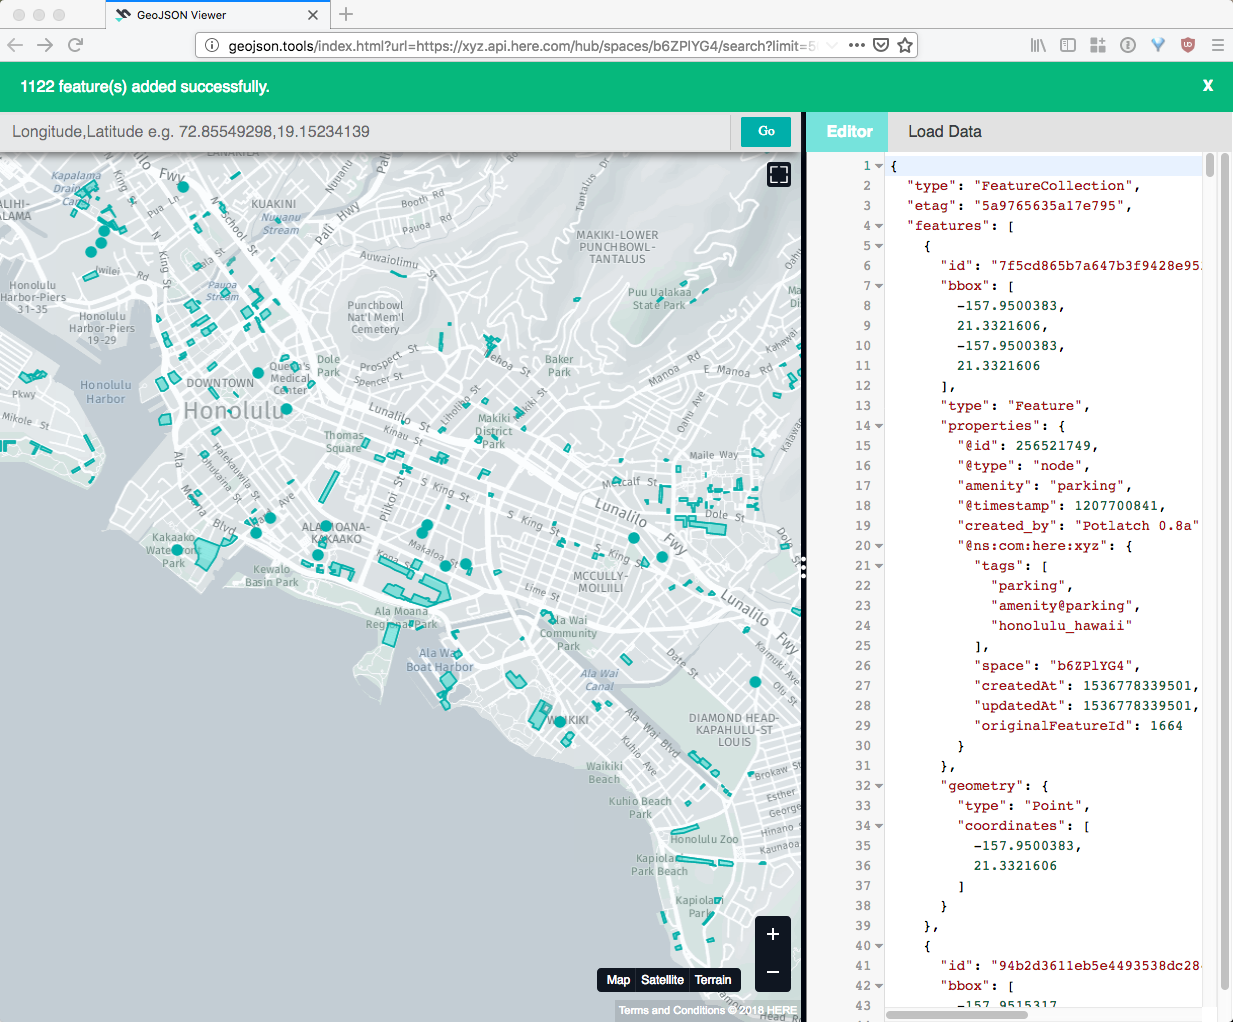
In your web browser, you should now see an interactive map of parking lots in Honolulu. These are just some of the many locations in the original Interline OSM extract. XYZ Spaces has taken the large GeoJSON file, tagged the many locations, and filtered only the parking lots for display:
Here are some other tags you can explore:
amenity@toiletamenity@atmamenity@bank
You can rerun the previous command with a new value after --tags. Or you can edit the URL in your existing web browser tab like so:

Now that we've selected a few tags that interest us, we'll use our XYZ space to create a web map. The tutorial will provide all of the necessary HTML and JavaScript code for the web map. We'll point out a few ways that you can customize your map further, to display different types of locations or to change the styling.
For more information on how to create web maps using XYZ, see also this tutorial.
Using your favorite text editor, copy and paste the following code as the index.html file in your project directory. This HTML code provides the basic XYZ Maps JS dependencies and an HTML element to serve as the placeholder for the map. When opened in a browser, this webpage will load the index.js script and turn the placeholder into an interactive map component:
<!DOCTYPE html>
<html>
<head>
    <style type="text/css">
    body {
        margin: 0px;
        padding: 0px;
    }
    #map {
        width: 100%;
        height: 100vh;
    }
    </style>
    <script src="https://xyz.api.here.com/maps/latest/xyz-maps-common.min.js" type="text/javascript" charset="UTF-8" ></script>
    <script src="https://xyz.api.here.com/maps/latest/xyz-maps-core.min.js" type="text/javascript" charset="UTF-8" ></script>
    <script src="https://xyz.api.here.com/maps/latest/xyz-maps-display.min.js" type="text/javascript" charset="UTF-8" ></script>
    <script src="https://xyz.api.here.com/maps/latest/xyz-maps-plugins.min.js" type="text/javascript" charset="UTF-8" ></script>
</head>
<body>
    <div id="map"></div>
    <script src="index.js" type="text/javascript" charset="UTF-8"></script>
</body>
</html>
Using your favorite text editor, copy and paste the following code into a file in your project directory. Save it as index.js. This sets up a basic web map using the XYZ Maps JS library:
// Provide your access token
var ACCESS_TOKEN = "REPLACE-WITH-YOUR-ACCESS-TOKEN";
var mapZoomLevel = 12;
var mapCenter = {longitude: -157.85915, latitude: 21.31629};

// Base layer
var layers = [];
// Base layer
// MVT example and styling from: https://xyz.api.here.com/maps/latest/playground/index.html#core_MVTLayer
var baseLayer = new here.xyz.maps.layers.MVTLayer({
    name: 'mvt-world-layer',
    remote: {
        url: 'https://xyz.api.here.com/tiles/osmbase/256/all/{z}/{x}/{y}.mvt',
        credentials: { access_token: ACCESS_TOKEN }
    },
    min: 1,
    max: 20,
    style: {
        backgroundColor: '#555555',
        strokeWidthZoomScale: function (level) {
            return level > 17 ? 1 : level > 14 ? .5 : .25
        },
        styleGroups: {
            'earth': [{ zIndex: 1, type: 'Polygon', fill: '#555555' }],
            'water': [{ zIndex: 2, type: 'Polygon', fill: '#353535' }],
            'landuse': [{ zIndex: 3, type: 'Polygon', fill: '#666666' }],
            'roads': [{ zIndex: 4, type: 'Line', stroke: '#ffffff', strokeWidth: 4 }],
            'roadshighway': [{ zIndex: 5, type: 'Line', stroke: '#ffffff', strokeWidth: 6 }],
            'buildings': [{ zIndex: 7, type: 'Polygon', fill: '#999999' }]
        },
        assign: function (feature, level) {
            var props = feature.properties;
            var kind = props.kind;
            var layer = props.layer; // the data layer of the feature
            var geom = feature.geometry.type;

            if (layer == 'water') {
                if (geom == 'LineString' || geom == 'MultiLineString') {
                    return;
                }
            }
            if (layer == 'roads') {
                if (kind == 'rail' || kind == 'ferry') {
                    return;
                }
                if (kind == 'highway') {
                    return layer + kind;
                }
            }
            return layer;
        }
    }
});
layers.push(baseLayer);

// Display map on #map
window.display = new here.xyz.maps.Map(document.getElementById("map"), {
    zoomLevel: mapZoomLevel,
    center: mapCenter,
    layers: layers
});
Where the scripts says REPLACE-WITH-YOUR-ACCESS-TOKEN, copy and paste your HERE XYZ access token. For more information on how to manage tokens, see the XYZ Hubs APIs documentation. Don't forget to save the file after making this edit. Additionally, the initial zoom level and map location are set as parameters to the here.xyz.maps.Map constructor, and can be changed if desired.
Add provider and space with tags
Next, we'll add more code to index.js. Copy and paste the following, making sure to change REPLACE-WITH-YOUR-SPACE-ID with your XYZ space ID (it should be the same value as when you ran the command SPACE_ID=...):
// HERE spaces
var space_id = 'REPLACE-WITH-YOUR-SPACE-ID';
var tags = ['amenity@bank,amenity@parking'];
var amenityStyle = null;
var provider = new here.xyz.maps.providers.SpaceProvider({
    name: 'HERE XYZ',
    level: 10,
    space: space_id,
    tags: tags,
    credentials: { access_token: ACCESS_TOKEN }
});
var layer = new here.xyz.maps.layers.TileLayer({
    name: space_id,
    min: 10,
    max: 20,
    provider: provider,
    style: amenityStyle
});
layers.push(layer);
The above code adds an overlay to your web map. It filters for locations with tags of amenity@bank and amenity@parking. In other words, it will display bank locations and parking lots from the crowdsourced Interline OSM extract. You can modify the tags in your script to display different locations instead.
Style map
Finally, let's apply styling to make sure that the ATM and bank locations are visible and attractive. For more on how on styling using the XYZ Maps JS library, see https://xyz.api.here.com/maps/latest/documentation/here.xyz.maps.layers.TileLayer.Style.html
Paste the following style definition into index.js, replacing the previous var amenityStyle = null:
var amenityStyle = {
    styleGroups: {
        parking: [
            {zIndex:0, type:"Line", stroke:"#1b9e77", strokeWidth:5}
        ],
        bank: [
            {zIndex:1, type:"Circle", radius:5, fill:"#d95f02", opacity: 0.8},
            {zIndex:2, type:"Line", stroke:"#d95f02", strokeWidth:5},
        ]
    },
    assign: function (feature, zoomlevel) {
        return feature.properties.amenity;
    }
};
The map style has two ingredients. First, a set of styleGroups that define how features will be drawn on the map, and second, an assign function that associates each feature to a key in styleGroups.
In this example, the style is determined by the value of the amenity tag. Parking features will be drawn with a simple green outline, and bank features will be drawn with an orange outline as well as small circles at each corner or as a single point. If the assign function returns null — if the feature is not an amenity — the feature will not be drawn.
If you want to display different tags on the map, you'll have to modify both the stylesGroups and the assign function.
Full index.js
For reference, here is what your complete index.js file should look like now:
// Provide your access token
var ACCESS_TOKEN = "REPLACE-WITH-YOUR-ACCESS-TOKEN";
var mapZoomLevel = 12;
var mapCenter = {longitude: -157.85915, latitude: 21.31629};

// Base layer
var layers = [];
var baseLayer = new here.xyz.maps.layers.TileLayer({
    name: 'Image Layer',
    min: 1,
    max: 20,
    provider: new here.xyz.maps.providers.ImageProvider({
        name: 'Live Map',
        url: 'https://{SUBDOMAIN_INT_1_4}.mapcreator.tilehub.api.here.com/tilehub/wv_livemap_bc/png/sat/256/{QUADKEY}?access_token=' + ACCESS_TOKEN
    })
});
layers.push(baseLayer);

// HERE spaces
var space_id = 'REPLACE-WITH-YOUR-SPACE-ID';
var tags = ['amenity@bank,amenity@parking'];
var amenityStyle = {
    styleGroups: {
        parking: [
            {zIndex:0, type:"Line", stroke:"#1b9e77", strokeWidth:5}
        ],
        bank: [
            {zIndex:1, type:"Circle", radius:5, fill:"#d95f02", opacity: 0.8},
            {zIndex:2, type:"Line", stroke:"#d95f02", strokeWidth:5},
        ]
    },
    assign: function (feature, zoomlevel) {
        return feature.properties.amenity || 'default';
    }
};
var provider = new here.xyz.maps.providers.SpaceProvider({
    name: 'HERE XYZ',
    level: 10,
    space: space_id,
    tags: tags,
    credentials: { access_token: ACCESS_TOKEN }
});
var layer = new here.xyz.maps.layers.TileLayer({
    name: space_id,
    min: 10,
    max: 20,
    provider: provider,
    style: amenityStyle
});
layers.push(layer);

// Display map on #map
window.display = new here.xyz.maps.Map(document.getElementById("map"), {
    zoomLevel: mapZoomLevel,
    center: mapCenter,
    layers: layers
});
Finally, let's open your index.html file in your web browser. Go to the File menu, select Open File, navigate to your project directory, and select index.html.
Here's what your map should look like:
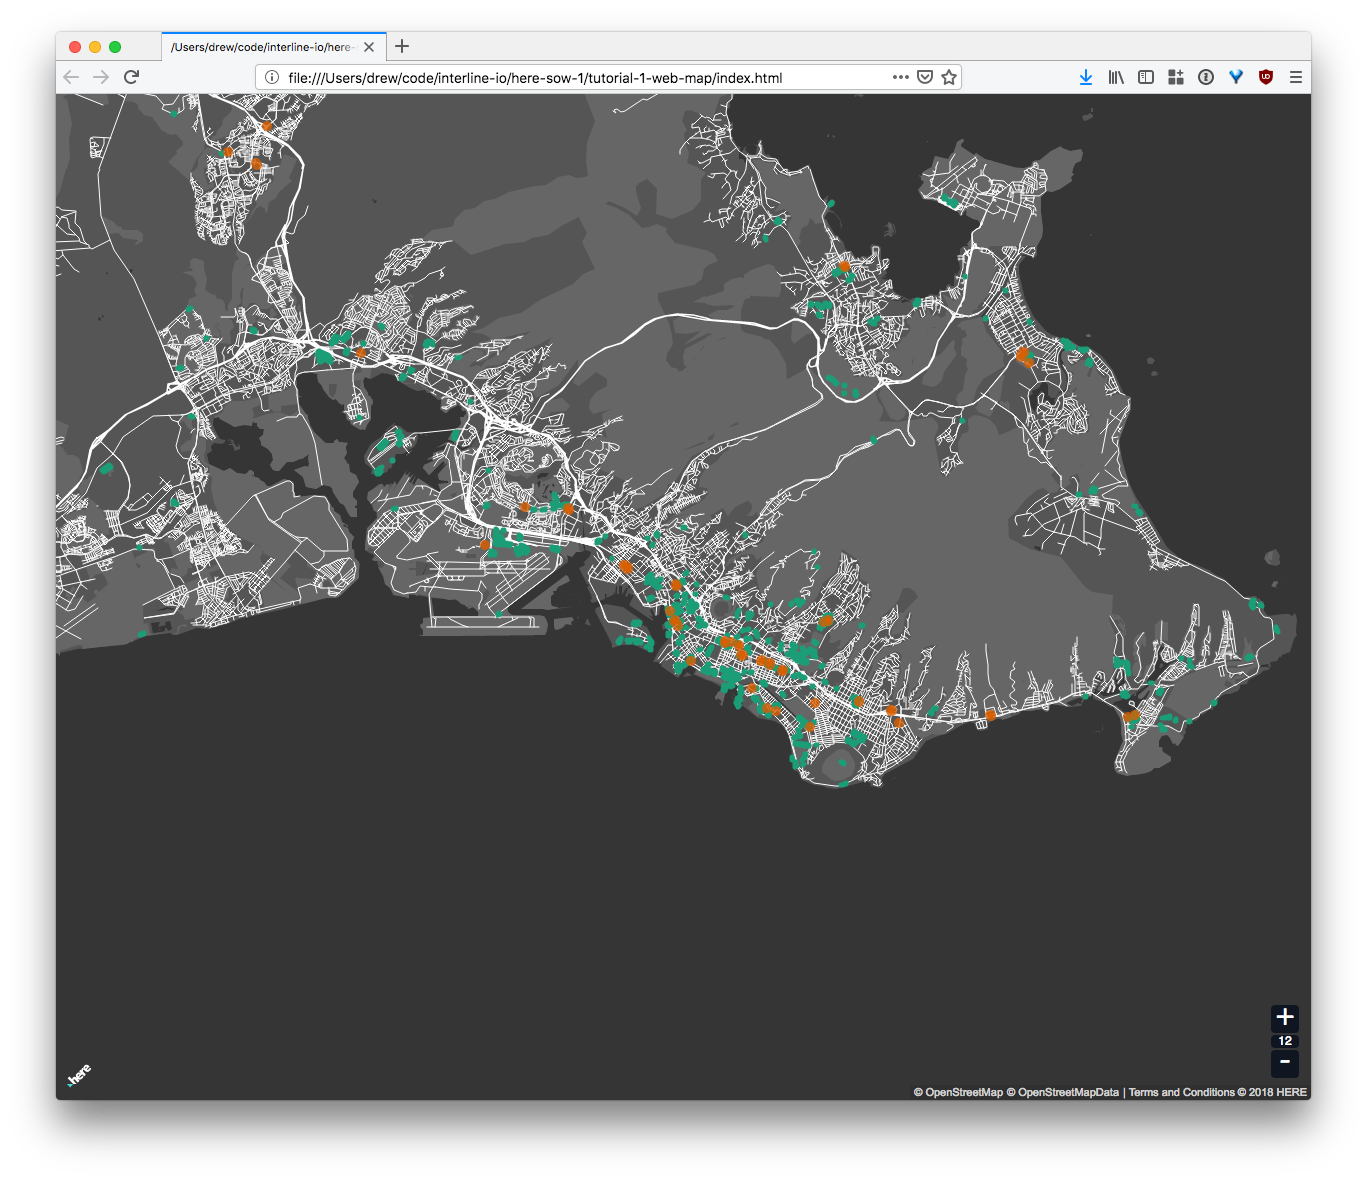
Banks are outlined in orange. Parking lots are outlined in green.
This map will be a useful tool for any tourist traveling to Honolulu with a rental car and an errand to run at a bank!
In this tutorial, you've learned:
- how to download Interline OSM extracts
- how to upload a GeoJSON file to an XYZ space
- how to filter by tags in the GeoJSON Viewer
- how to create a basic web map
Using your new skills, here are some activities that you can do next:
- change the tags that you use to filter in your web map
- download an Interline OSM extract for a different region (there are over 200 available!)