
The California Coastal Commission recently updated YourCoast, an interactive web map of over 1,600 public access points along the California coast. It's a genuinely useful tool: you can filter by restrooms, surfing, camping, dog-friendliness, stroller access, and more.
You can also filter by car parking.
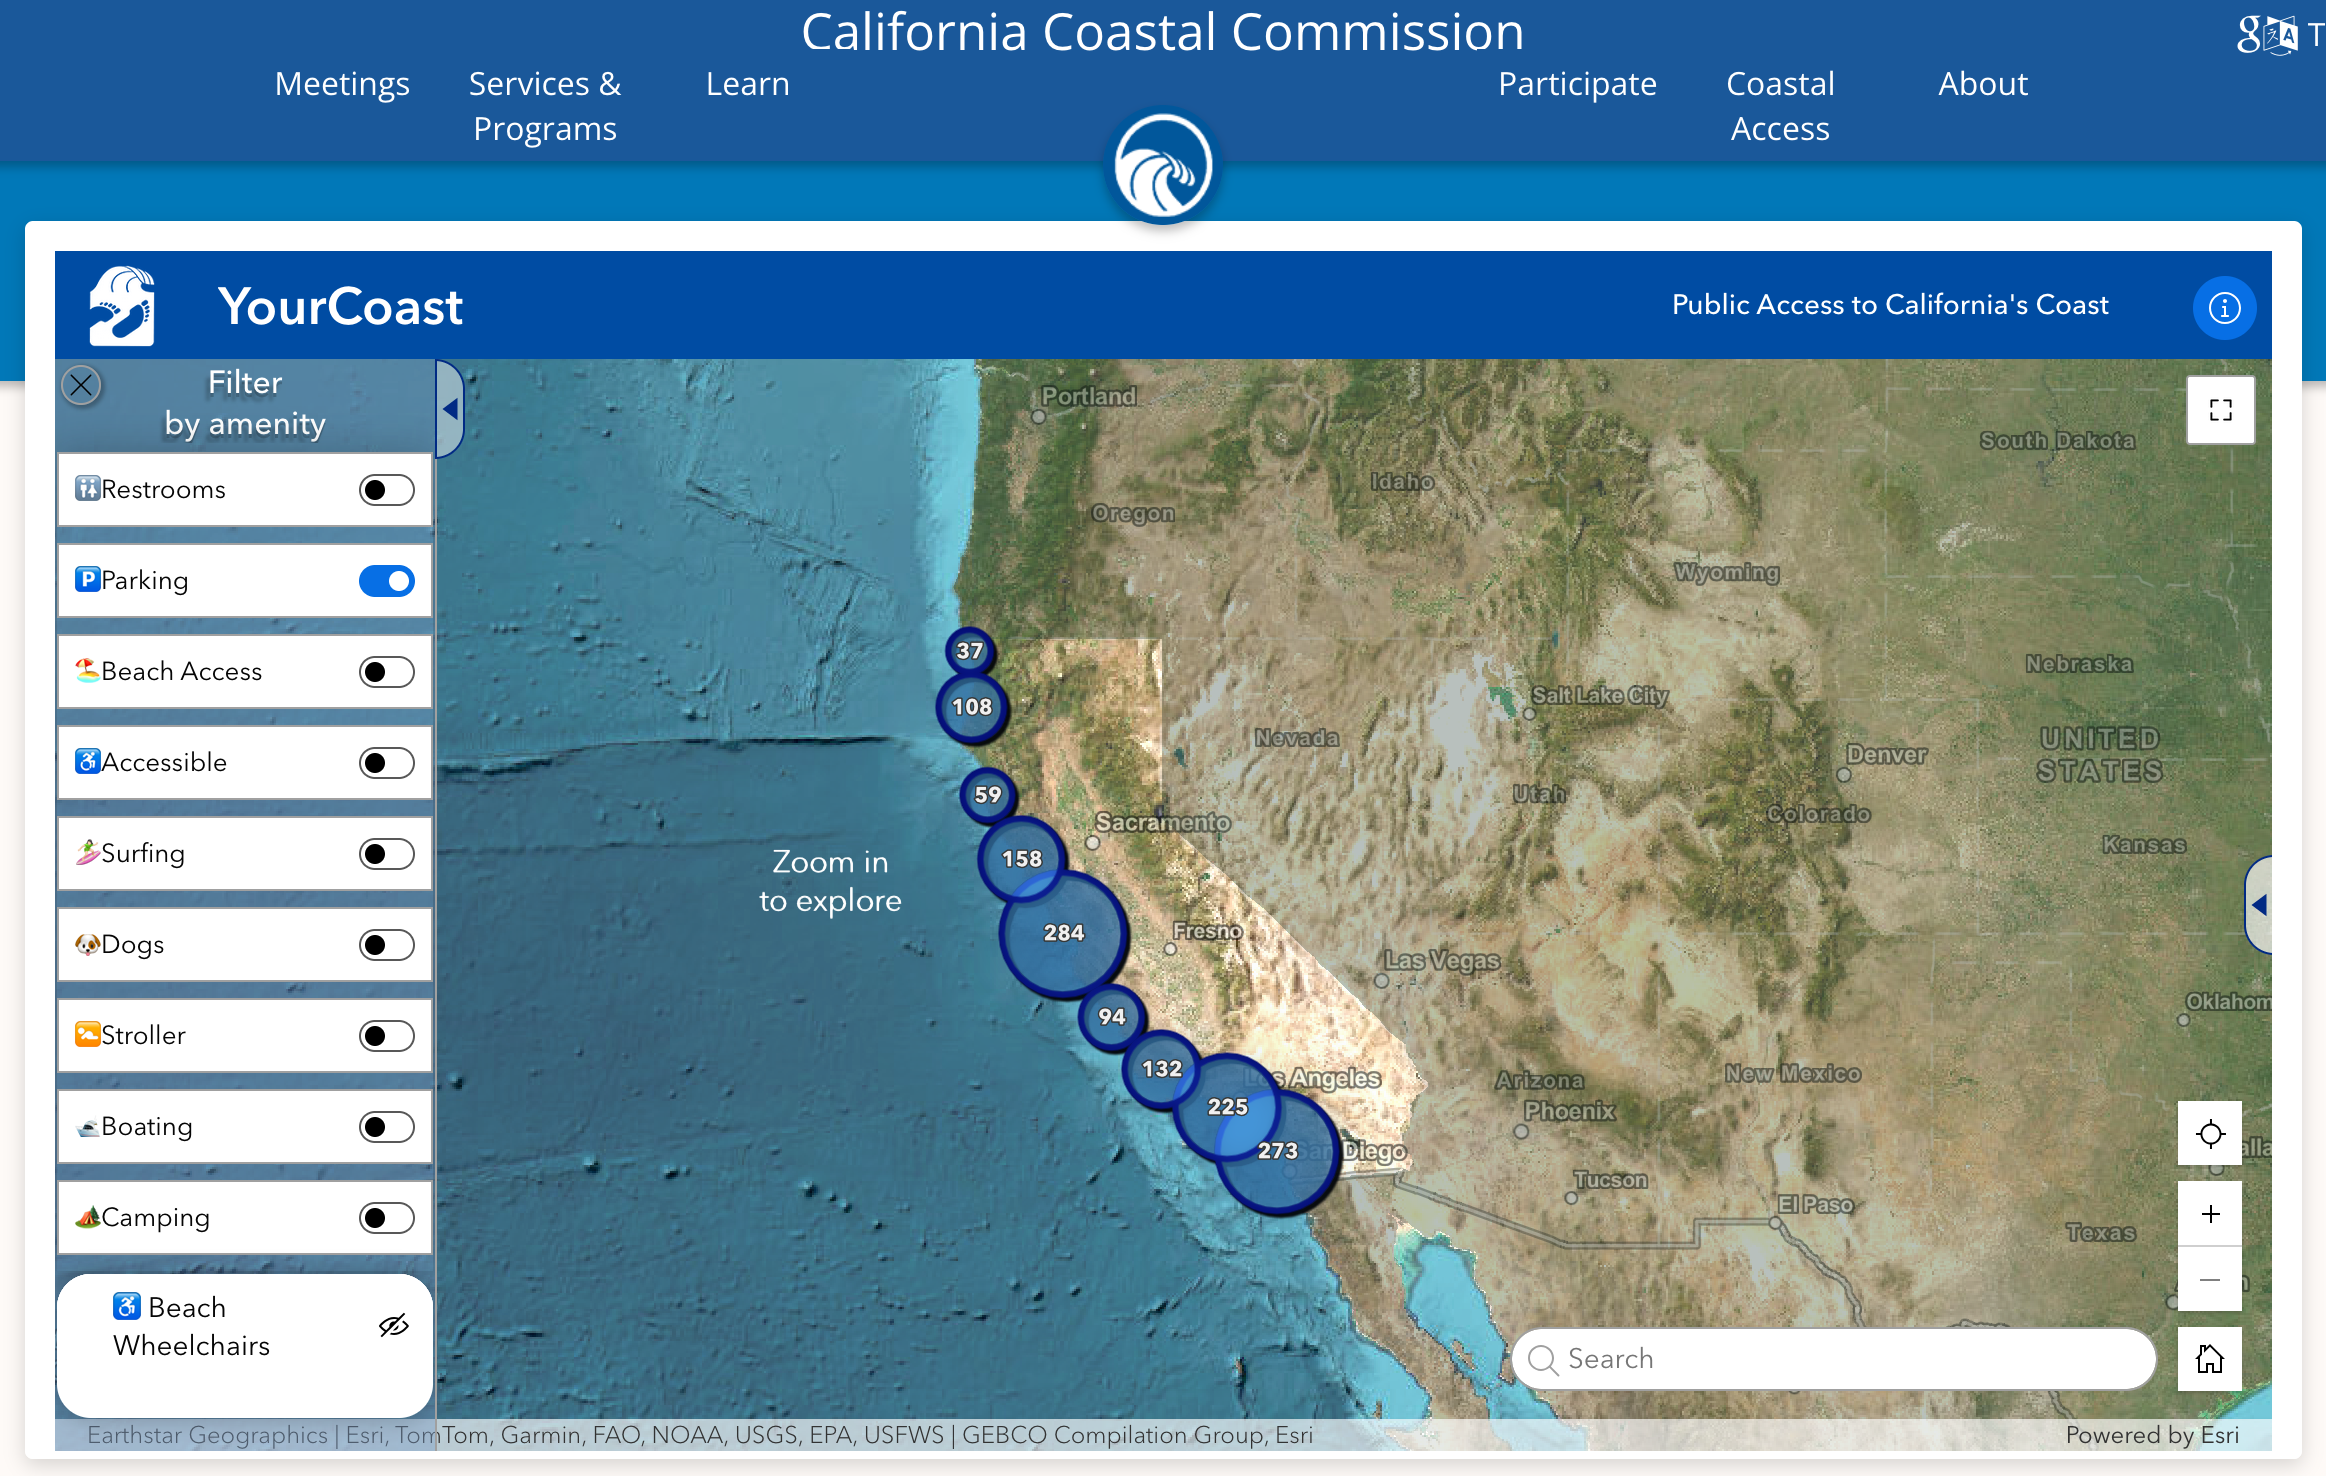
What you can't filter by is public transit. The filter panel lists ten amenity types, but getting to the beach without a car isn't one of them. This is an unfortunate gap for an agency whose founding mandate under the landmark California Coastal Act is to "maximize public access" to the coast.
California's coastal access data has just a bit of transit
The Commission publishes its access point data as an open dataset, which is great. Digging into the raw CSV, there is a PUBTRANSP column, but out of 1,631 access points, only 39 have a value of "Yes" and 10 have "No." The remaining 1,582 are blank.
That field is currently too sparse to be useful. So, let's enrich the Coastal Commission's public access points using Transitland Datasets.
Spatial join: Transitland Datasets + Coastal Commission open data
Rather than calling an API for each of the 1,600+ access points, we'll use Transitland Datasets, bulk exports of transit stop and route data that you can download and work with locally.
What makes Transitland Datasets especially useful here is the schedule summary data: for every stop, the dataset includes departure counts broken down by day of week. This isn't just a list of stop locations. Rather, it tells you how much service actually runs at each stop, every day of the week.
The plan:
- Load the Transitland stops dataset and filter to California using the
adm1_isocolumn - Load the Coastal Commission's access points CSV
- Search at two radii: a half mile (~805 m) for stops within walking distance, and three miles (~4.8 km) for stops that are in the approximate area but might require a hike or a bike.
- Aggregate the results, including which routes serve nearby stops and how often they run on weekdays and weekends
Getting the data
You'll need two files:
- Transitland stops dataset (US): Available through Transitland Datasets (which are free for non-commercial use). The stop-oriented CSV includes stop locations, route names, agency names, vehicle types, and scheduled departure counts for each day of the week. See the data dictionary for full column definitions.
- California Coastal Commission access points: Download from their ArcGIS Hub open data site in CSV format.
Python script using GeoPandas and uv
Here's a Python script that performs the analysis using GeoPandas for the spatial join. It defines its dependencies inline, so if you have uv installed, you can run it directly (with no need to set up a virtualenv or perform a pip install):
#!/usr/bin/env -S uv run --script
# /// script
# requires-python = ">=3.10"
# dependencies = ["geopandas", "pandas"]
# ///
"""
Find California coastal access points with nearby public transit
by spatially joining Coastal Commission open data with a Transitland Dataset.

Searches at two radii:
  🚌  ½ mile:  walking distance to a transit stop
  🔍  3 miles: transit in the area, worth planning a trip

Usage:
    uv run coastal_transit.py <transitland-stops.csv> <AccessPoints.csv>
"""

import sys
import pandas as pd
import geopandas as gpd

WALK_M = 805   # ~0.5 miles
NEAR_M = 4828  # ~3.0 miles


def _clean(val):
    """Return empty string for NaN-ish values."""
    s = str(val or "").strip()
    return "" if s in ("", "nan", "None") else s


def load_stops(path):
    """Load Transitland stops CSV, filter to California, build route labels."""
    print("Loading Transitland stops...", file=sys.stderr)
    df = pd.read_csv(path, dtype=str)
    ca = df[df["adm1_iso"] == "US-CA"].copy()
    ca["stop_lat"] = ca["stop_lat"].astype(float)
    ca["stop_lon"] = ca["stop_lon"].astype(float)
    ca["tue"] = pd.to_numeric(ca["departure_count_dow2"], errors="coerce").fillna(0).astype(int)
    ca["sat"] = pd.to_numeric(ca["departure_count_dow6"], errors="coerce").fillna(0).astype(int)
    ca["sun"] = pd.to_numeric(ca["departure_count_dow7"], errors="coerce").fillna(0).astype(int)

    def route_labels(row):
        labels = []
        for i in range(1, 6):
            name = _clean(row.get(f"route_short_name_{i}"))
            name = name or _clean(row.get(f"route_long_name_{i}"))
            agency = _clean(row.get(f"agency_name_{i}"))
            if name and agency:
                labels.append(f"{name} ({agency})")
        return labels

    ca["routes"] = ca.apply(route_labels, axis=1)
    print(f"  {len(ca):,} California stops", file=sys.stderr)
    return gpd.GeoDataFrame(
        ca, geometry=gpd.points_from_xy(ca.stop_lon, ca.stop_lat), crs="EPSG:4326"
    )


def load_access_points(path):
    df = pd.read_csv(path, encoding="utf-8-sig")
    df = df.dropna(subset=["LATITUDE", "LONGITUDE"])
    print(f"  {len(df):,} coastal access points", file=sys.stderr)
    return gpd.GeoDataFrame(
        df, geometry=gpd.points_from_xy(df.LONGITUDE, df.LATITUDE), crs="EPSG:4326"
    )


def spatial_join(stops, pts, radius_m):
    """Buffer access points by radius_m and find all stops within."""
    buf = pts.copy()
    buf["geometry"] = buf.geometry.buffer(radius_m)
    joined = gpd.sjoin(stops, buf, predicate="within")
    return joined.groupby("index_right").apply(
        lambda g: pd.Series({
            "stops": len(g),
            "tue": int(g["tue"].sum()),
            "sat": int(g["sat"].sum()),
            "sun": int(g["sun"].sum()),
            "routes": list(dict.fromkeys(r for rs in g["routes"] for r in rs)),
        }),
        include_groups=False,
    )


def main():
    if len(sys.argv) < 3:
        print("Usage: uv run coastal_transit.py <transitland-stops.csv> <AccessPoints.csv>")
        sys.exit(1)

    stops = load_stops(sys.argv[1]).to_crs("EPSG:3310")
    pts = load_access_points(sys.argv[2]).to_crs("EPSG:3310")

    walk = spatial_join(stops, pts, WALK_M)
    near = spatial_join(stops, pts, NEAR_M)

    # Build result: prefer ½-mile data; fall back to 3-mile
    rows = []
    for idx, pt in pts.iterrows():
        w = walk.loc[idx] if idx in walk.index else None
        n = near.loc[idx] if idx in near.index else None

        if w is not None and w["stops"] > 0:
            tier, data = "walk", w
        elif n is not None and n["stops"] > 0:
            tier, data = "near", n
        else:
            tier, data = "none", None

        rows.append({
            "name": str(pt["Name"])[:49],
            "county": pt["COUNTY"],
            "tier": tier,
            "stops": int(data["stops"]) if data is not None else 0,
            "tue": int(data["tue"]) if data is not None else 0,
            "sat": int(data["sat"]) if data is not None else 0,
            "sun": int(data["sun"]) if data is not None else 0,
            "routes": data["routes"] if data is not None else [],
        })

    result = pd.DataFrame(rows)

    # Print table
    print(f"\n{'Name':50s} {'County':15s} {'':4s} {'Stops':>5s} {'Tue':>5s} {'Sat':>5s} {'Sun':>5s}  Routes")
    print("=" * 120)
    for _, r in result.iterrows():
        icon = {"walk": "🚌", "near": "🔍", "none": "  "}[r["tier"]]
        route_str = ", ".join(r["routes"][:4])
        if len(r["routes"]) > 4:
            route_str += f"  (+{len(r['routes']) - 4} more)"
        print(
            f"{r['name']:50s} {r['county']:15s} {icon:4s} "
            f"{r['stops']:>5} {r['tue']:>5} {r['sat']:>5} {r['sun']:>5}  "
            f"{route_str or '-'}"
        )

    walk_n = (result["tier"] == "walk").sum()
    near_n = (result["tier"] == "near").sum()
    none_n = (result["tier"] == "none").sum()
    print(f"\n{'='*60}")
    print(f"🚌 Within ½ mile (walkable):       {walk_n:>5,}")
    print(f"🔍 Within 3 miles (hikeable):       {near_n:>5,}")
    print(f"   No transit within 3 miles:      {none_n:>5,}")
    print(f"   Total:                          {len(result):>5,}")


if __name__ == "__main__":
    main()
Run it:
uv run coastal_transit.py tl-dataset-US-stops.csv AccessPoints.csv
uv reads the inline dependency metadata, installs geopandas and pandas into an isolated environment, and runs the script. The spatial joins use California Albers (EPSG:3310) for accurate meter-based distance calculations.
Results: transit frequency to reach the California coast
We ran that script against an April 2026 Transitland Dataset covering all US transit operators. Out of 1,625 coastal access points with coordinates:
- 🚌 913 have a transit stop within a half mile (more than half of all coastal access points in the state)
- 🔍 427 more have transit within three miles (likely hikeable, assuming there are appropriate pedestrian shoulders or trails)
- The remaining 285 have no transit within three miles
Here's a sample of results across all three tiers:
| Name | County | Tier | Stops | Tue | Sat | Sun | Routes |
|---|---|---|---|---|---|---|---|
| Santa Monica State Beach | Los Angeles | 🚌 | 10 | 732 | 497 | 497 | 2, 9, 43, 3 (Big Blue Bus) |
| Santa Cruz Beach Boardwalk | Santa Cruz | 🚌 | 7 | 426 | 342 | 344 | 19B, 20, 19 (Santa Cruz METRO) +1 more |
| Monterey Bay Aquarium | Monterey | 🚌 | 17 | 547 | 419 | 419 | 2, 1, A (Monterey-Salinas Transit) +2 more |
| Half Moon Bay State Beach | San Mateo | 🔍 | 60 | 1,054 | 885 | 885 | 294, 15, 117, 18 (SamTrans) |
| Huntington City Beach | Orange | 🚌 | 13 | 506 | 551 | 549 | 29, 29A, 25 (OCTA) +1 more |
| Coronado City Beach | San Diego | 🚌 | 9 | 451 | 365 | 243 | 901, 904 (MTS) |
| Beach Front Park (Crescent City) | Del Norte | 🚌 | 22 | 267 | 156 | 2 | 199, 1, 20, 2 (Redwood Coast Transit) +5 more |
| Fort Bragg Coastal Parkland | Mendocino | 🚌 | 5 | 73 | 10 | 4 | 5, 65 (Mendocino Transit Authority) |
| Point Reyes Hostel | Marin | 🔍 | 2 | 17 | 14 | 14 | 68 (Marin Transit) |
| Peter Strauss Ranch | Los Angeles | 🔍 | 54 | 879 | 476 | 476 | 161 (Metro - Los Angeles), 423, 422 (LADOT), KS (Kanan Shuttle) |
| Pelican State Beach | Del Norte | 🔍 | 4 | 12 | 8 | 0 | 20 (Redwood Coast Transit), Coastal Express (Curry Public Transit) |
| Pfeiffer Big Sur State Park | Monterey | 0 | 0 | 0 | 0 |
A few patterns to point out:
- Departure counts tell a story that proximity alone can't. The table uses Tuesday as a representative weekday (as that day avoids most holidays). Santa Monica has 732 weekday and nearly 500 Sunday departures across 10 nearby stops, so you can show up any day without needing to closely follow a schedule. Fort Bragg has stops nearby, but 73 weekday departures drop to 10 on Saturday and 4 on Sunday. Crescent City's Beach Front Park has 267 weekday departures that drop to 156 on Saturday and just 2 on Sunday. Instead of asking is there a bus stop nearby? using Transitland Datasets, we can ask is there a bus stop with service nearby? (Note that these are raw departure counts summed across all nearby stops and both directions, so they represent service intensity in the area.)
- Some access points show zero transit even at three miles. This is genuinely the case for remote stretches like the Lost Coast and Big Sur. (In fairness, Highway 1 can be washed out by weather, so you may not be traveling to some of those coastal access points by private auto either!)
- The three-mile radius catches real transit corridors where the stop isn't right at the beach. Point Reyes Hostel, for example, has no stops within a half mile but 17 weekday and 14 Sunday departures within three miles. That's Marin Transit route 68 running along Sir Francis Drake Boulevard to Point Reyes Station village. In Southern California, Peter Strauss Ranch is another example: 879 weekday and 476 Sunday departures within three miles, from LA Metro 161 plus LADOT and Calabasas shuttles threading through the Santa Monica Mountains, but none of them drop you at the trailhead. The 🔍 tier flags these cases: transit exists in the corridor, and it's worth checking the Transitland map or using the Transitland Routing API to see if the full journey is actually feasible. (Note that some of these sites aren't literally right on the water. They may be on bluffs or in ocean-fronting preserves, so a hike is part of the point.)
- Half Moon Bay State Beach is a good case for the "hikeable" tier. It shows 60 stops and over 1,000 weekday departures within three miles (SamTrans routes 294, 15, 117, and 18) but the closest stops are on Highway 1, not at the beach entrance. A short walk or bike ride will take you from the bus to the beach. (That's a favorite spot of our Bay Area-based staff!)
This is exactly the kind of analysis that the schedule summary columns in Transitland Datasets are designed for. Each stop row includes departure counts for every day of the week (departure_count_dow1 through departure_count_dow7). Departure counts are also broken apart by direction, for finer-grained analysis, but that's beyond the scope of this blog post.
Going further: full trip planning with Transitland's routing API
Finding nearby stops and counting departures tells you whether transit exists near a beach. It doesn't tell you whether you can actually get there from home in a reasonable amount of time.
For that, you need a transit routing engine. The Interline Routing Platform provides transit routing powered by the same GTFS feeds behind Transitland, combined with OpenStreetMap's pedestrian network via the Valhalla engine. You could use it to compute actual travel times from residential areas to coastal access points, accounting for real schedules, transfers, and the final walking leg from the last stop to the sand.
Imagine a version of YourCoast where the filter panel included: "Reachable by transit from my location in under 60 minutes." Or imagine an equivalent for your own state or country with a rich dataset of destinations, ready to reach via public transit. The data and APIs to build that exist today.
Resources
- Transitland Datasets, bulk CSV/GeoJSON exports of stops, routes, and schedules: transit.land/documentation/datasets/data-dictionary
- Transitland map, explore transit stops and routes visually: transit.land/map
- Transitland REST API (stops endpoint), query individual stops by location: transit.land/documentation/rest-api/stops
- Transitland API key signup: transit.land/documentation#signing-up-for-an-api-key
- California Coastal Commission open data: ArcGIS Hub dataset
- YourCoast web map: coastal.ca.gov/YourCoast