


At Interline, we spend much of our time with open geodata APIs. We create our own open geodata APIs (like Transitland) and we use others (for example, whenever we need to throw a bunch of GeoJSON on a base map). At their best, open geodata APIs are fun — you get to combine pieces together to create something new. Then again, public APIs can have many limitations — combine together a few and you can end up with the worst of all worlds: duplicate data, misregistered overlays, a slow user experience, incompatible data formats… With all these mixed experiences in our minds, we’ve been playing with the initial beta of HERE XYZ. It’s a brand new developer service from one of the oldest names in geodata.
HERE XYZ provides the full set of components that “modern” geo developers have come to expect: GeoJSON input and output, “slippy map” libraries, a RESTful API, a JavaScript SDK, a cross-platform CLI, base maps and styles. As we’ve been experimenting with the HERE XYZ beta, we’ve found it provides some unique combinations that make it especially well suited to combining open geodata APIs — especially in large quantities.
Combining geodata is nothing new. Ian McHarg, a prominent environmental designer, printed maps on transparent plastic sheets and overlaid them atop each other, inspiring the idea of layers in GIS (geographic information systems):
Image credit: University of Pennsylvania
More recently, Google Maps brought us mashups. At first, it involved hacking the Google Maps JavaScript code in order to overlay crimes in Chicago and Craigslist house listings:
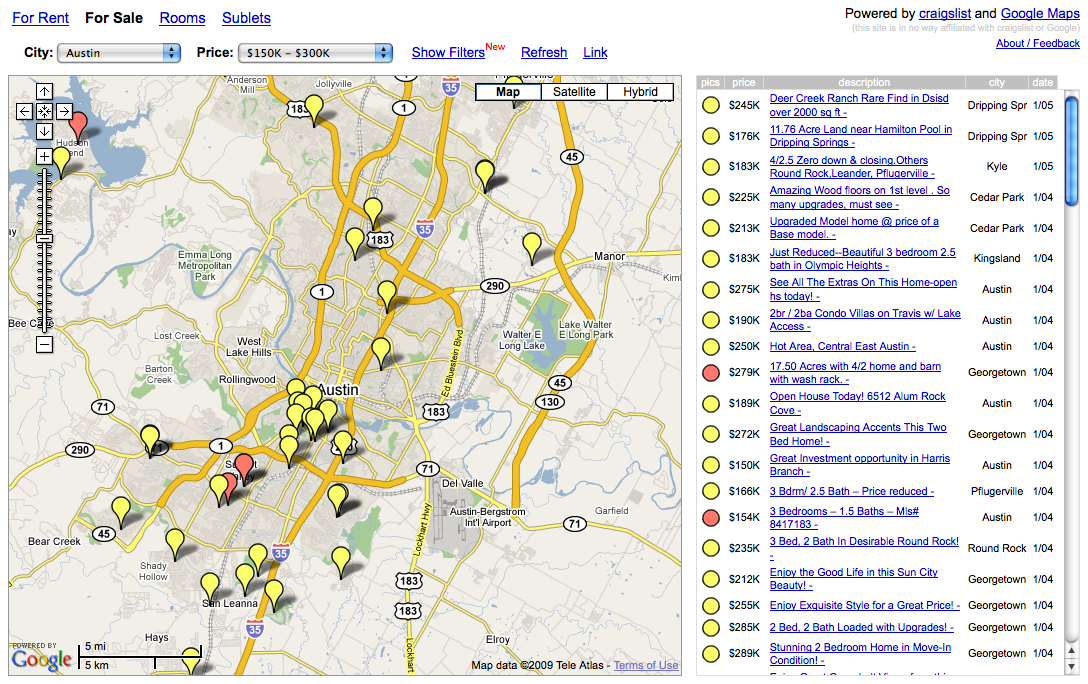
Image credit: housingmaps.com
Neither hacking nor reverse-engineering are required any more to combine multiple sources of geodata in a web browser. Companies like Google, Esri, Mapbox, Carto — also a now defunct start-up where we previously worked, called Mapzen — all offer accessible APIs for creating web maps. We’ve also been freed of many of the constraints on dataset size in 2005 mashups. Original mashups involved drawing points and other geographic features on top of base-map images, with a low limit on the number of these vector features that could be drawn at once. More recent techniques send both the base map and overlays as vector tiles. Instead of an image, a vector tile is effectively a square of data, which can be pre-generated by a server. Many vector tiles are then loaded and drawn by your web browser simultaneously.
We’ve left behind the constraints of mashups — and it also feels like we’ve forgotten the fun of mashups. Vector tiles help greatly with performance, but often add complexity to the overall set of steps required to combine together existing and new data sources on a web map or another type of visualization.
Our experiments with the HERE CLI and the XYZ API are bringing back that creative spirit of 2005 mashups. The XYZ platform generates vector tiles near instantly for any new imported data sources. The HERE CLI and XYZ API provide a range of ways to import GeoJSON files, connect to APIs, or stream in from other CLI tools. It’s the best of 2005 and 2018. If you use the SDKs to style your web maps to look like the transparency overlays in Ian McHarg’s book Design With Nature, it’s the best of 1969 proto-GIS, too.
We’re collaborating with the HERE XYZ team to turn our experiments into tutorials that demonstrate how Interline’s open geodata services can be combined, mixed, filtered, analyzed, and visualized. In the first tutorial, you’ll fetch and filter data from Interline OSM Extracts:
In the second tutorial, you’ll query the Transitland API repeatedly to build up an analysis and a web map of just not subway locations but also the frequency of how often each subway line operates. (Especially when working with geodata for transportation applications, both space and time matter.) We’ll show you how to do this for the entire planet:
The sample projects and tutorials take intermediate and advanced users on a tour through some of the unique features of XYZ and the HERE CLI:
- filtering Interline OSM Extracts using OpenStreetMap tags
- writing scripts that stream geodata from external APIs into an XYZ space using the HERE CLI
- using multiple API queries to aggregate together properties about the same features (identified by unique IDs, such as Transitland Onestop IDs)
- quickly building global tile sets
We’re experimenting with additional features, for creating a new generation of mashups, and we look forward to sharing more soon.
Now, get started with our first two tutorials on combining HERE XYZ, Interline OSM Extracts, and Transitland.


