

Earlier this year, Interline and the Metropolitan Transportation Commission released the Regional GTFS Feed for the San Francisco Bay Area. The Regional GTFS Feed is produced on a daily basis and made available through 511 SF Bay’s Open Data Portal and its Open Transit Data API.
We’re pleased to now share a series of additions to the Regional GTFS Feed that we’ve released together over recent months:
- Historical Feeds which provide a retrospective look at an entire month of service
- Station Pathways and Levels to provide richer wayfinding for all types of riders
- Fares and Transfer Discounts [beta] to calculate the cost of transit journeys on and across the eight largest agencies
Historical Feeds
Since we released the Regional GTFS Feed in January, much has changed across the Bay Area. Transit agencies and their dedicated staff have rapidly reduced and re-targeted transit service for those riders who perform essential work or depend upon transit for their necessary journeys.
Using the newly released Historical Feeds component of the Regional GTFS Feed, we can visualize how transit service has changed throughout the Bay Area from January to July of 2020:
Historical Regional Feed products are fully valid GTFS feeds, but they differ somewhat in their contents from the daily Regional Feed products. Read on to understand the process used to produce the Historical Regional Feed products and their key differences, or skip to the end of this section to download Historical Feed products.
Slicing regional feeds
Each day, the Regional Feed is produced from the versions of agency feeds on 511.org that provide the best view of service on that day. Each month, the Historical Regional Feed creation process takes these Regional Feeds and combines them together, taking one day of service from each feed, which we are calling a “slice.”
For example:
| Feed filename | Published | Contributes service slice for |
|---|---|---|
| mtc-regional-feed-2020-04-24.zip | 2020-04-24 | 2020-04-24 |
| mtc-regional-feed-2020-04-23.zip | 2020-04-23 | 2020-04-23 |
| mtc-regional-feed-2020-04-22.zip | 2020-04-22 | 2020-04-22 |
| mtc-regional-feed-2020-04-21.zip | 2020-04-21 | 2020-04-21 |
| mtc-regional-feed-2020-04-20.zip | 2020-04-20 | 2020-04-20 |
If the Regional Feed for a given day is missing, the closest previous day provides service. For instance, if 2020-04-22 was missing, the 2020-04-21 feed slice would cover both 2020-04-21 and 2020-04-22.
Global entity copying
Agencies, stops, and routes are considered “global”, and are handled using a simple ID-based merge with the most recent version winning. For example, if BART has a route with ID “OR-S” that is called “Richmond - Warm Springs”, but then later renames it to “Richmond to Warm Springs”, then the latter version will be used.
Trip hashing, comparison, and copying
Trips are more complicated and handled separately. A simple combining of all the trips and stop_times in all of the input files can easily create a GTFS feed that is too large for practical use, especially given that programs like OpenTripPlanner need to hold the entire schedule in memory. Therefore, duplicate copies of trips are detected using a hash based approach and only copied to the output once. This reduces the output size by approximately 90%.
For example, here are three hypothetical versions of Trip ID “BA:2210503” from three consecutive days of input regional feeds.
| Feed filename | Trip ID | Route ID | Service ID | Headsign | 1st stop | 2nd stop | n stops | Hash |
|---|---|---|---|---|---|---|---|---|
2020-04-24.zip |
BA:2210503 |
BA:OR-S |
BA:Wkd_BASE-Weekday-07 |
Warm Springs/South Fremont | RICH 5:03 |
DELN 5:07 |
PLZA 5:10... |
8c4ecb |
2020-04-23.zip |
BA:2210503 |
BA:OR-S |
BA:Wkd_BASE-Weekday-07 |
Warm Springs/South Fremont | RICH 5:03 |
DELN 5:07 |
PLZA 5:10... |
8c4ecb |
2020-04-22.zip |
BA:2210503 |
BA:OR-S |
BA:Wkd_BASE-Weekday-07 |
Warm Springs to South Fremont | RICH 5:04 |
DELN 5:06 |
PLZA 5:12... |
a4bf1a |
For each of these, the hashing function takes into account all trip attributes, all the calendar attributes for that trip, and the full details of each entry in stop_times.txt. Any change in any field will result in a different hash. This allows us to directly compare trips between versions of the input feed. Above, all details and schedule for 2020-04-23 and 2020-04-24 match exactly, so these trips two will be considered identical. The trip for 2020-04-22 has some minor differences in name and schedule, so will generate a different hash, and be considered a different trip.
As the historical feed merging program processes each input feed, it calculates the hash of each trip in the feed. If it has not seen a trip before, it copies it to the output and notes the hash for future use. If it has been seen before, it is not copied again. To prevent clashes, the original Trip IDs are appended with the trip hash (e.g. BA:2210503 -> BA:2210503:8c4ecb). The merging program then takes all trips in the input feed (both seen and unseen) and examines the calendars to see which are active for each day in this slice, and then creates calendar_dates.txt entries for each trip on each day where that trip is scheduled to run. The original service IDs are changed to be the same as the hash appended Trip ID, and the calendar is unrolled into a day-by-day format, but it works reliably. This hashing approach is resource efficient and allows us to create historical feeds of arbitrary duration while minimizing the output size.
Example output calendar_dates.txt:
| Service ID | Date | Exception Type |
|---|---|---|
BA:2210503:8c4ecb |
2020-04-24 | 1 (Added) |
BA:2210503:8c4ecb |
2020-04-23 | 1 (Added) |
BA:2210503:a4bf1a |
2020-04-22 | 1 (Added) |
In this way, the 8c4ecb version of the trip is scheduled to run on the two days of input data where it was seen, and the a4bf1a version is scheduled to run on the other day.
Differences between Regional and Historic feeds
Historic Regional Feeds are equivalent to the original daily Regional Feeds in the stops, routes, and scheduled services they contain. Using a Historic will produce the same output in a routing engine or another type of analysis.
Historic Feeds are different from Regional Feeds in their specific GTFS structure:
calendars.txtrecords are removed and rewritten incalendar_dates.txttrips.txtrecords are hashed and compared (as described above)- IDs for global records are namespaced (as described above)
These differences should not affect routing engine or similar types of analysis. However, keep these differences in mind if you are trying to use historical feeds to understand changes in GTFS data and its practices over time at Bay Area agencies.
Download Historical Feed products
To use the Historical Feed products:
- Sign up for a 511 Open Data API token
- Download from
http://api.511.org/transit/datafeeds?api_key=[your_key]&operator_id=RG&historic=YYYY-MM(for example, to request May 2020:historic=2020-05) - At the start of each month, the Historic Feed for the last month is created and posted. You may download as many months as you wish and combine them to analyze as many months/quarters/years as you wish at once.
As of this blog post, the following months are available for download (that is, you can you any of these values for the historic query parameter):
2020-012020-022020-032020-042020-052020-062020-07
Station Pathways and Levels
The Regional Feed exists to both merge together individual agency GTFS feeds and to serve as a home for new GTFS data that describes cross-agency conditions. The daily Regional Feed now comes with layouts for 35 key transit stations across the Bay Area, each of which serves multiple agencies. Using the newly added pathways.txt and levels.txt files in GTFS, Interline and MTC are now able to provide more detailed information about how to transfer from one agency to another. This includes information on elevators, escalators, and routes that may not be accessible to those in wheelchairs. Pathways and levels information will equip trip planning apps to provide more helpful wayfinding information to their users, particular those who are new to the Bay Area or who have limited vision.
35 Regional Transit Hubs
Here is a list of the 35 stations currently in the Regional Feed:
| Transit station/hub | County |
|---|---|
| Embarcadero BART | San Francisco |
| Montgomery BART | San Francisco |
| Caltrain Station 4th & King | San Francisco |
| Salesforce Transit Center | San Francisco |
| 12th St Oakland City Center BART | Alameda |
| El Cerrito Del Norte BART | Contra Costa |
| 19TH St Oakland BART | Alameda |
| Powell ST BART | San Francisco |
| Civic Center BART | San Francisco |
| Walnut Creek BART | Contra Costa |
| Richmond BART/Amtrak | Contra Costa |
| San Jose Diridon Station | Santa Clara |
| Palo Alto Station | Santa Clara |
| San Rafael Transit Center | Marin |
| Millbrae BART | San Mateo |
| Pleasant Hill BART | Contra Costa |
| San Francisco Ferry Terminal | San Francisco |
| Daly City BART | San Francisco |
| Santa Rosa Transit Mall | Sonoma |
| Union City BART | Alameda |
| MacArthur BART | Alameda |
| Dublin/ Pleasanton BART | Alameda |
| Warm Springs/ South Fremont BART | Alameda |
| Santa Clara Caltrain | Santa Clara |
| Oakland Coliseum BART | Alameda |
| SFO | San Francisco |
| Fairfield Transportation Center | Solano |
| OAK | Alameda |
| Petaluma Transit Mall | Marin |
| Vallejo Ferry Terminal | Solano |
| Mountain View Station | Santa Clara |
| Great America | Santa Clara |
| Napa Intermodal | Napa |
| SJC | Santa Clara |
| Great Mall/Milpitas BART | Santa Clara |
Note that just as the ongoing pandemic has made our work on the Historic Feed all the more relevant, our work on Station Pathways and Levels has had to adapt to current circumstances. Our staff have been working from home using aerial imagery, architectural drawings, station maps, and other materials. Interline’s Station Editor tool also works on tablets, and we look forward to again going out into the field to all of these stations to correct and improve details.
We welcome questions and corrections sent to the 511SFBayDeveloperResources mailing list.
Using Station Pathways and Levels
Download the daily Regional Feed like so:
- Sign up for a 511 Open Data API token
- Download from
http://api.511.org/transit/datafeeds?api_key=[your_key]&operator_id=RG - Look for the
pathways.txtandlevels.txtfiles inside the zip archive. - For more information, see the static GTFS documentation and the GTFS-Pathways extension proposal document.
Fares and Transfer Discounts
To date, the Regional GTFS Feed has focused on how to plan a journey by transit. Now we’re curating and adding additional data to help riders understand how to pay for their journeys. The Bay Area’s Regional GTFS Feed is now the first in the world to include data using the GTFS Fares-v2 specification. This newly proposed specification allows us to model the many different fare products and discounts that are available to the Bay Area’s transit riders. For example, we can now account for how some agencies provide riders a discount when they pay by Clipper Card rather than by cash. (Clipper Card is the contact-less payment card and system operated by MTC and available on buses, trains, and ferries throughout the Bay Area.) We can also capture how riders can receive a discount when transferring from certain agencies to other agencies. Read on for a detailed example of how Fares-v2 work in practice, or skip ahead to use the Fares-v2 beta data.
An Example of Fares-v2 in Practice
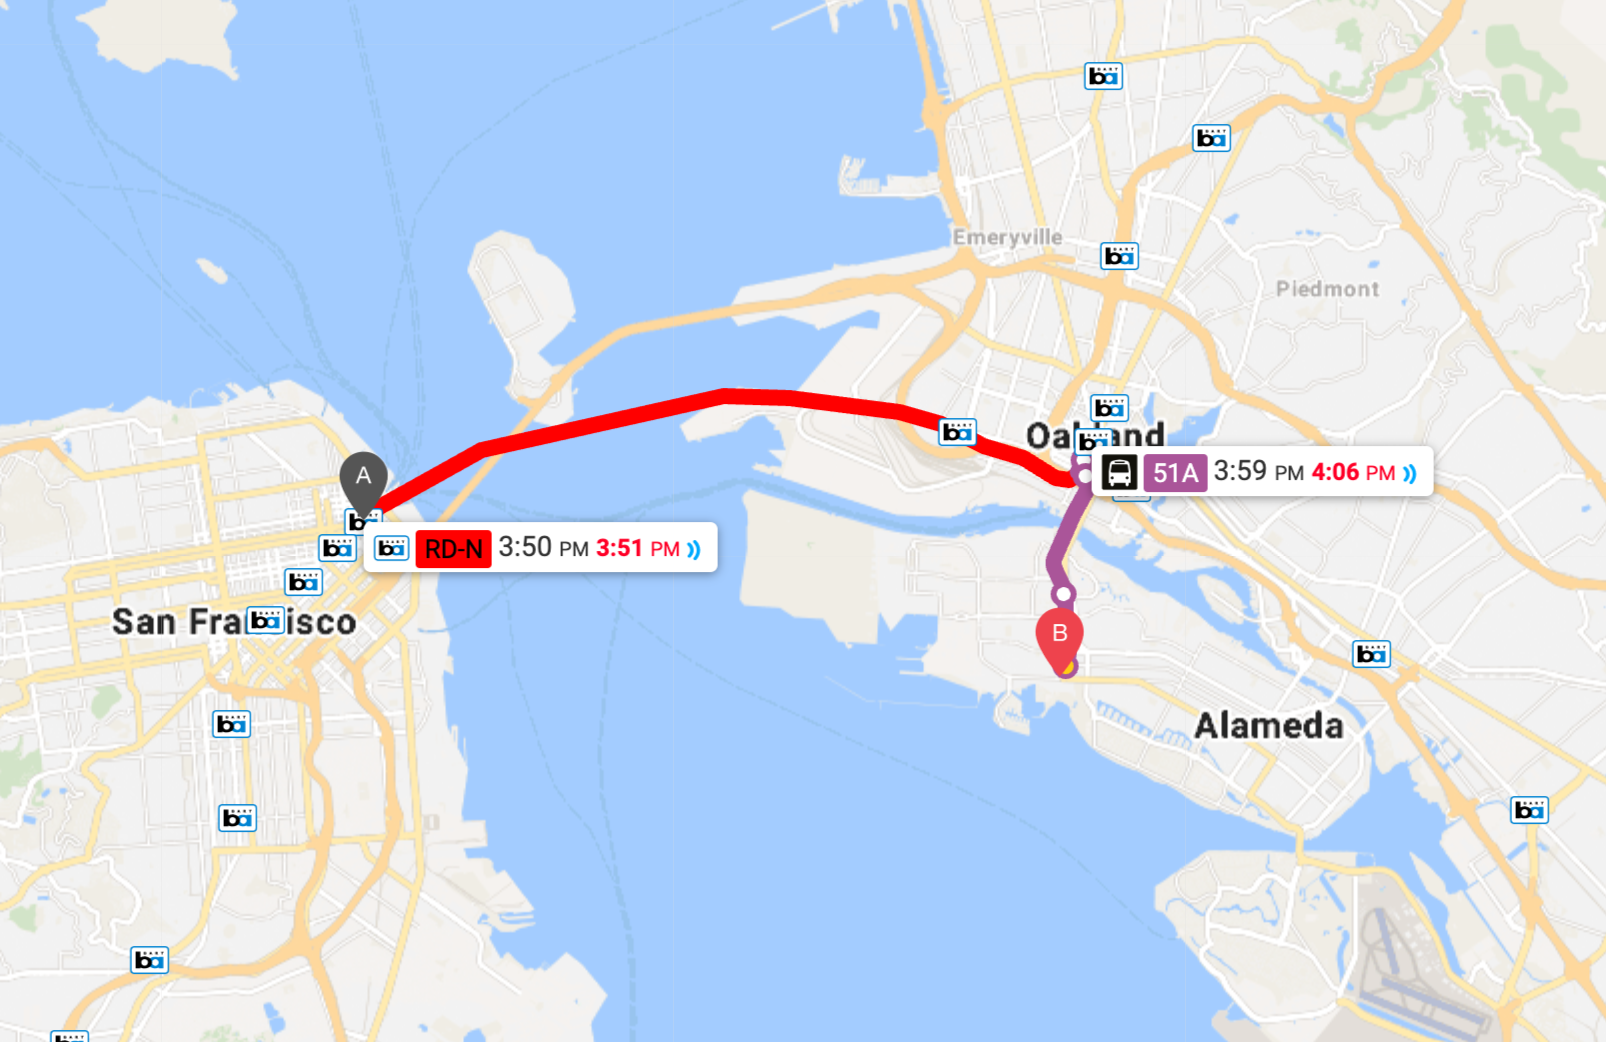
Fares-v2 expands the traditional route- and zone-based GTFS fares model with several additional files, each focused on modeling a different part of a complex fare scheme. Imagine a rider making a transfer from BART to AC Transit; both BART and AC Transit have different prices for adult fares, eligible discount fares, and different prices when paying with cash or when using a Clipper Card; additionally, the discount applied when transferring from BART to AC Transit has different values and rules when using Clipper. Calculating the individual fares for each leg of this trip requires a description of any zones that apply to routes and stops (fare_networks.txt and fare_areas.txt), the costs and requirements of the base fare for each leg (fare_leg_rules.txt), any discount categories that might include the rider (fare_profiles.txt), and the type of payment used by the rider (fare_containers.txt). All of these factors are considered and then used to search for any transfer discounts that may apply for the trip (fare_transfer_rules.txt).
Let’s work through the hypothetical trip above, first taking BART from Embarcadero Station to 12th St. in Oakland, and then riding an AC Local bus, 51A, to Alameda.
The following is an except from fare_leg_rules.txt with some columns removed for brevity. This file contains sets of rules that are matched against a single leg of a trip, without regard to transfers. The columns from_area_id, to_area_id, fare_container_id and fare_category_id references values defined in the other files mentioned above.
| order | leg_group_id | from_area_id | to_area_id | amount | fare_container_id | fare_category_id | notes |
|---|---|---|---|---|---|---|---|
| 90 | BA: | EMBR | 12TH | 1.35 | clipper | BA:Senior/Disabled Clipper | Embarcadero to 12th with Clipper and discount |
| 100 | BA: | EMBR | 12TH | 3.70 | clipper | Embarcadero to 12th with Clipper | |
| 110 | BA: | EMBR | 12TH | 4.20 | Embarcadero to 12th with cash surcharge |
The BART leg would match the first the rules above based on from_area_id and to_area_id, with fares of $1.35, $3.70, and $4.20. However, the first two rules are only available when using a Clipper Card (fare_container_id), and the first of these is only available to riders eligible for a discounted fare (fare_category_id). The order field is used to select the correct fare when multiple rules match the trip leg: any applicable discounted Clipper fare would match first, followed by adult Clipper fare, then finally the fare including additional charge for cash riders. In the event two (or more) rules match with the same order value, both are considered valid options to present to the rider.
| order | leg_group_id | from_area_id | to_area_id | amount | fare_container_id | fare_product_id | fare_category_id | notes | |
|---|---|---|---|---|---|---|---|---|---|
| 100 | AC:local | AC:local | AC:local | 2.25 | clipper | Adult local fare with clipper $2.25 | |||
| 110 | AC:local | AC:local | AC:local | 2.5 | Adult local fare $2.5 | ||||
| 100 | AC:local | AC:local | AC:local | 1.12 | AC:senior | Discounted local fare $1.12 with Clipper | |||
| 100 | AC:local | AC:local | AC:local | 1.25 | AC:senior | Discounted local fare $1.25 | |||
| 100 | AC:local | AC:local | AC:local | 0 | AC:local:monthly | Free local fare with monthly pass |
The AC Transit fare rules are similar, with the addition of a few extra columns. The 51A is an East Bay local only route (to_area_id is assumed), and matches each rule, and the rules for discounts and cash are applied as above. The fare_product_id field describes additional rules that are available to users of certain prepaid products, such as day passes and monthly passes. In this case, a rider with an Adult Local 31 Day Pass ($84, described in fare_products.txt) would enjoy a free ride. More complex AC Transit fares use additional columns not pictured here (fare_network_id) and handle cases such as riding a Transbay bus and the different prices applied when riding within the East Bay vs. taking the trip all the way to the Salesforce Transit Center in downtown San Francisco.
Any applicable transfers are calculated by reading the rules in fare_transfer_rules.txt and matching each leg of the trip against each subsequent leg of the trip. This can create quite complicated models, but let’s start by looking at our BART and AC Transit legs. The clever bit is that many fare_leg_rules.txt rules can share the same leg_group_id, which simplifies the number and types of transfer rules that must be defined. For example, all of the BART rules above use BA: and all of the AC Transit rules use AC:local. The table below is an except of fare_transfer_rules.txt.
| order | from_leg_group_id | to_leg_group_id | fare_container_id | amount | duration_limit | duration_limit_type | fare_transfer_type | spanning_limit | notes |
|---|---|---|---|---|---|---|---|---|---|
| 100 | BA: | AC:local | clipper | -0.5 | 90 | 2 | 1 | 2 | 1 credit of $-0.50 to AC w/in 90 minutes |
| 110 | BA: | AC:local | -0.25 | 1 | 3 | Cash: 2 fare credits of $0.25 each |
Two different discounts apply when taking an AC Transit leg after a BART leg. When using Clipper, a $0.50 (amount=-0.5, fare_transfer_type=1) discount is applied to the first AC Transit leg (spanning_limit=2, which means it can only match a subjourney of two legs). Alternatively, a paper transfer slip given to cash users contains two tabs, each of which applies a $0.25 discount to the AC Transit cash fare (spanning_limit=3, or a subjourney of up to three legs). Additionally, the Clipper discount expires within 90 minutes after tagging off BART (duration_limit=90, duration_limit_type=2). Because the order value is different, these two transfer options are mutually exclusive to Clipper and cash riders respectively.
The combination of matching fare rules and fare transfer rules allows describing even complicated transfers, such as discounts to SamTrans local bus riders who hold a Caltrain 2 zone or higher monthly pass, the several categories of upgrade charges when transfering from an AC Transit Local to an AC Transit Transbay bus, and the many varied products and transfers that apply full or partial fare to trips on the Dumbarton Express.
Agencies in the Beta Release
Note that this is a “beta” release. The GTFS Fares-v2 specification is still being finalized. It does not fully capture some functionality, like how AC Transit and VTA use “fare capping” so that riders never have to pay more in one day than the cost of a day pass. We also expect that as trip planners and other apps begin to consume the Regional Feed’s fare data that we may need to revise some of the data or our schema.
To our knowledge, Interline is the only organization to have a “rules engine” that can calculate journey costs using GTFS Fares-v2 data. We expect that as other organizations adopt the Interline fares rules engine or build their own equivalents, we may need to revisit some of the assumptions built into the engine.
The beta release of data includes fares and transfer discounts within and between eight agencies:
- BART
- SFMTA
- AC Transit
- SamTrans
- VTA
- Caltrain
- Golden Gate Transit (bus only; not ferries)
- Dumbarton Express
This list includes the seven largest agencies and a key connector across San Francisco Bay (Dumbarton Express). It should provide a broad enough sample of fares and transfer discounts to power a wide range of potential applications. This sample is also deep enough to inform analyses of fares, the cost of riding transit, and ideally even ways to reform fares and transfer discounts to produce more equitable outcomes for Bay Area transit riders.
Using Fares and Transfer Discounts
Download the daily Regional Feed like so:
- Sign up for a 511 Open Data API token
- Download from
http://api.511.org/transit/datafeeds?api_key=[your_key]&operator_id=RG - For more information about the fares and transfer discount files in the GTFS feed, see the GTFS-Fares v2 proposal document.
Interline and MTC expect to improve both the Fares-v2 beta data and schemas as we learn more. We welcome questions and corrections sent to the 511SFBayDeveloperResources mailing list.
Public Transit in 2020
A final note that behind every piece of transit data and every multi-modal trip plan are real people who drive vehicles, serve riders, and maintain equipment and facilities. Thank you to all the front-line workers keeping the Bay Area’s public transit systems and riders moving safely!
Acknowledgements
Credit and many thanks to project team members including Ian Rees and Ruth Miller (Interline), Nisar Kapeel and Kapeel Daryani (MTC), and our partners at Bay Area transit agencies.


